- TradeWithTitans Newsletter
- Posts
- My Trick To Avoid Overthinking
My Trick To Avoid Overthinking
How to Master Tenet #3 (And Why You’re Overthinking It)
Jay Strizzi
September 24, 2024
Traders,
I can’t even count the number of times people ask me, "Jay, how do I get started with order flow?" It's like they expect a magic formula, but the truth is, I’ve boiled everything down into what I call TWT’s 3 Core Tenets. You might remember a few weeks ago we dug into tenet #2. Today? We’re hitting tenet #3, and I’m going to show you how simple it is to dominate the markets with it.
But first, let’s take a detour into a bit of stats. Yeah, I know, you probably slept through this part in school thinking it was useless. I know I did. But trust me, this is where the magic happens—and it’s a concept I picked up intuitively from watching the tape. Turns out, they even gave it a fancy name. Who knew?
The Weather Lesson You Didn’t Know You Needed
Picture this: you’re spending summer in sunny California, and you check the weather each day. Most of the time it’s a comfortable 75-85 degrees. Life’s good.
But every once in a while, you wake up and it’s roasting—pushing 100 degrees, heatwave outcries all over the news, and you’re sweating bullets thinking, “Is global warming trying to fry us all?”
Then, on another day, it’s barely 60 degrees and drizzling. “Rain? In July? What happened to that perfect California summer?”
Now, if you zoom out and track the weather over a few months, you’d notice something pretty obvious:

Distribution of Daily High Temperatures
See that chart? The x-axis shows the daily high temperature, and the y-axis is how many times we hit that temperature. Surprise, surprise—most days are around 80 degrees. The 100-degree scorchers? Rare. The 60-degree drizzlers? Even rarer. We call this a distribution.
Still with me? Good, because now we’re getting to the market.
The Market Profile: Your Secret Weapon
Just like the weather, stock prices behave like a random variable. Sure, external factors cause crazy days, but over time, prices usually settle into a distribution. And when I trade intraday, I’m basically building my own version of that weather chart, but for price action. I break the day into 30-minute chunks, and every time a price trades, I slap a letter on it: A for the first half hour, B for the second, and so on.
What you end up with looks a bit like this:
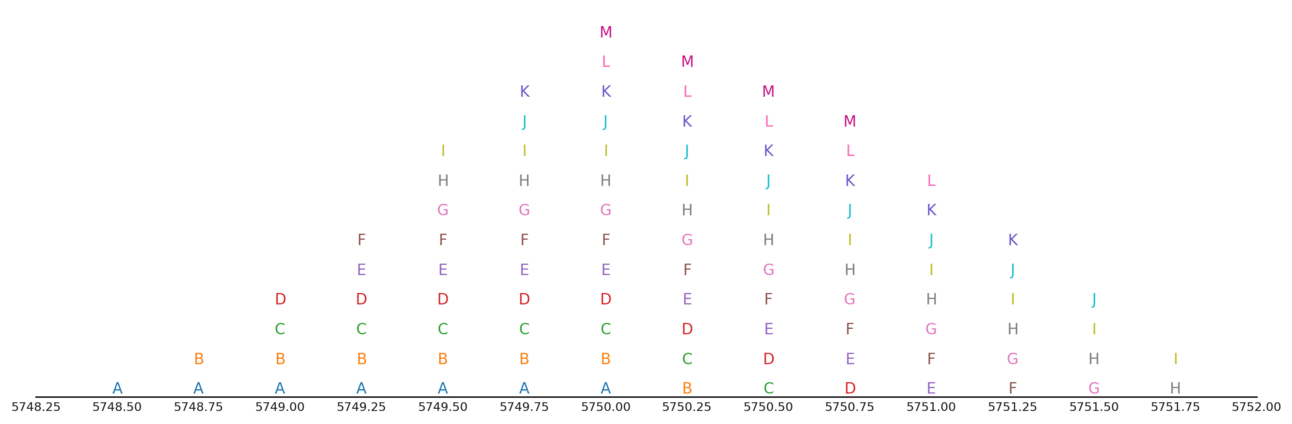
Prices Traded: One Letter Per 30 Minute Period
Flip it sideways, and boom—you’ve got a market profile. Sounds fancy, right? But it’s really just showing the distribution of prices over time. This is how I stay grounded while everyone else is losing their minds.
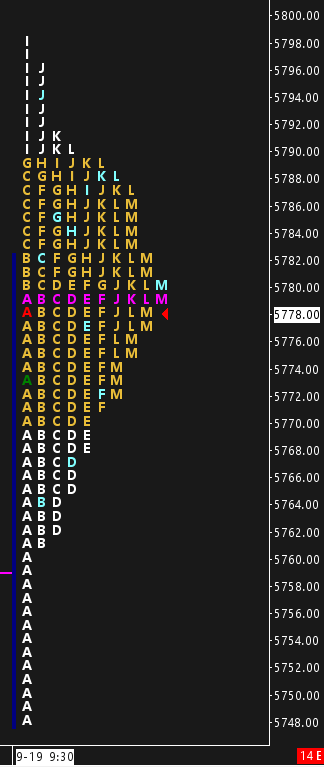
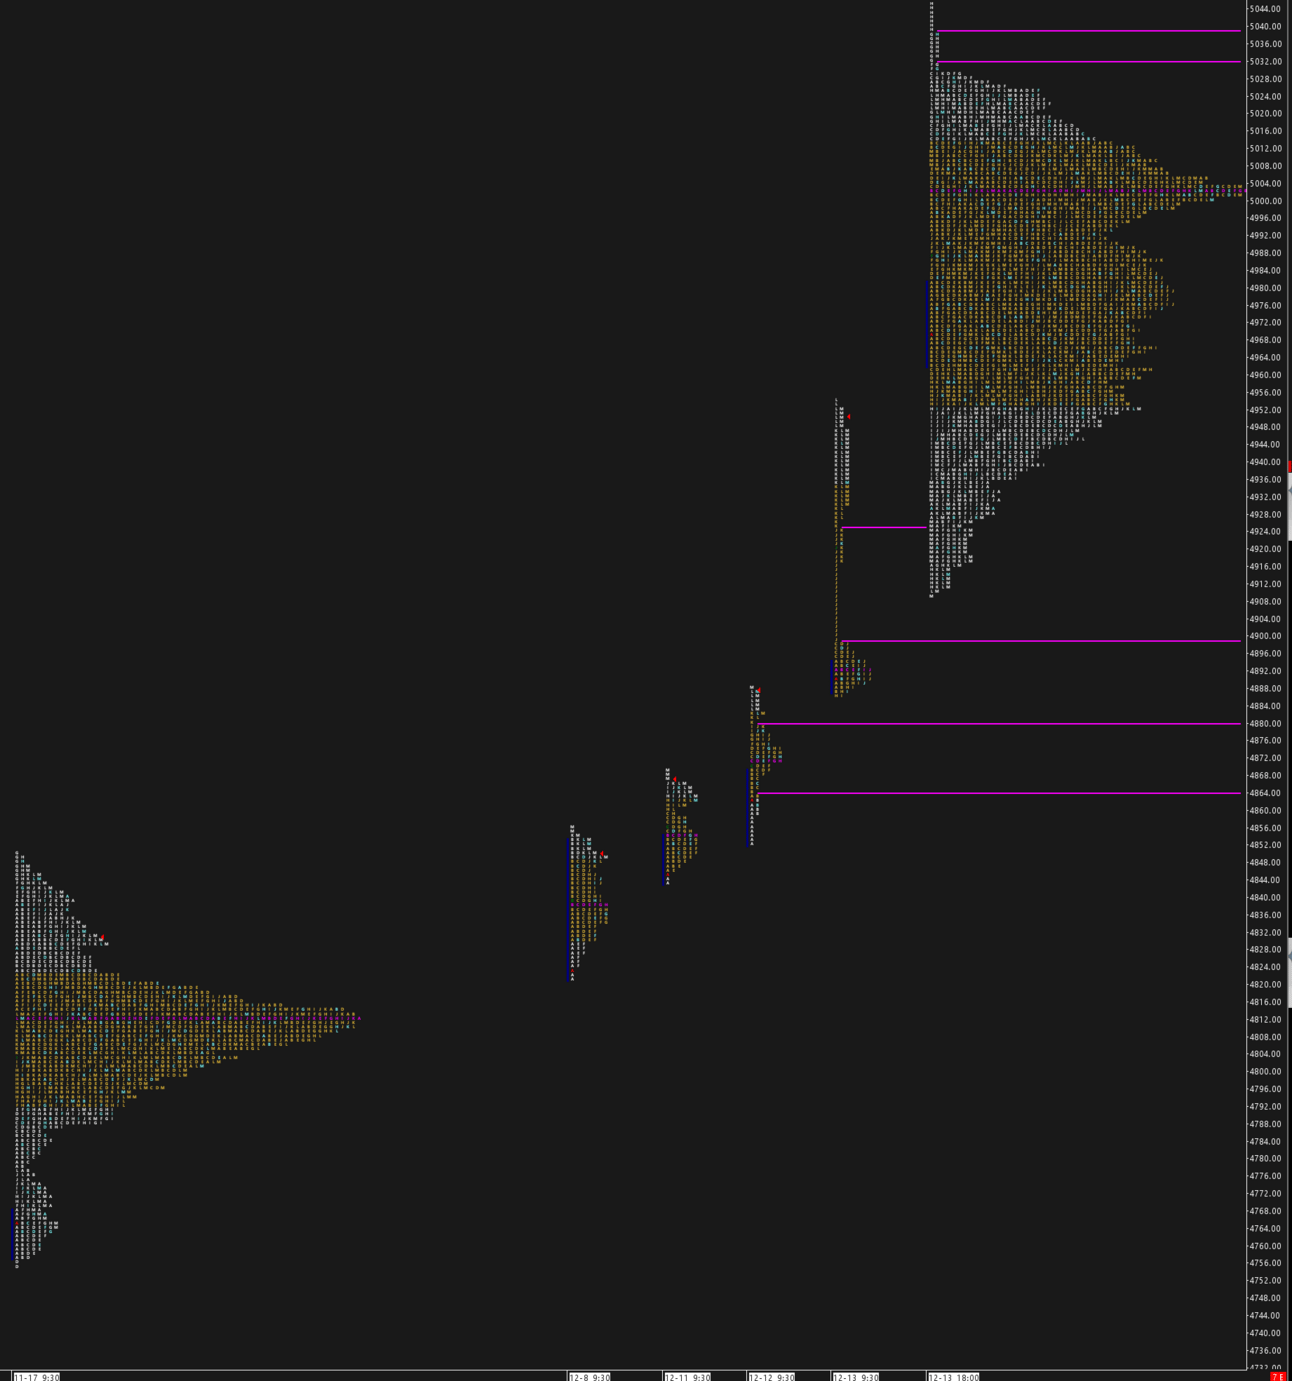
ES Market Profile Chart
For example, when ES Futures hit the higher end of the profile distribution, Twitter explodes. "The printer is on!" "The bears are done!" "We’ll never see red again!"
Meanwhile, I look at the profile and think: “This is just one of those 100-degree days in summer. People are freaking out for nothing.”
In fact, last Thursday I used this exact approach to short the market high:
Can you imagine what it's like to buy the literal all time high?
Probably the same dudes that kiss their dad on the lips goodnight
— Jay 'PoutinePapi' Strizz (@StrizziJ)
6:04 PM • Sep 19, 2024
I calmly placed my sell orders while while the reply guys remained euphoric. And sure enough, we reverted back to the middle for a nice, easy profit.
By the way, that’s what we call a balancing market—and it’s the most common type of market you’ll see.
Other Profile Shapes: Don’t Overthink It
I can already hear the replies. "But Jay… my market profile doesn’t look like a perfect curve! What about those ‘b’ and ‘P’ profiles you talk about?"
Good question. Yes, those shapes do matter—but don’t get caught up in the noise. It’s like flipping out over one freak rainy day during a perfect summer.
The easiest way to see for yourself is to combine the profiles from the last few days, and watch how the distribution takes shape. Take this profile for instance:

Unbalanced ES Market Profile Chart
Looks odd, doesn’t it? Definitely not balanced. But, if I combine it all the prior profiles over roughly a week, suddenly the uniform distribution takes shape:
Combined Balanced ES Market Profile Chart
See? Not so weird anymore, right? That’s why I say, don’t get lost in the day-to-day fluctuations. Take a step back, look at the bigger picture, and stay grounded.
Jay’s Market Profile Trick
If the distribution isn’t clear to you, try combining profiles to see it all come together.
Tenet #3: The Market Trades in Distributions
And here we are—TWT’s third core tenet of order flow: The market trades in distributions.
Sounds simple? That’s because it is. Every time I’m about to make a move, I always check which part of the distribution the market is trading in. If we’re in the middle? I wait. If we’re at the edge of a multi-week distribution? That’s my cue to swing for the fences.
Sure, sometimes I get smacked. It happens—you’ve seen it on Twitter, you’ve probably laughed at me in the comments. But I don’t care. If the risk/reward is there, no regrets. I know my thesis, I know where I’m wrong, and if I’m right, I win big. That’s the kind of trade I live for.
TWT’s 3rd Tenet of Order Flow
The market tends to trade in distributions. Identify the key distributions to unlock deeper market insights.
Spotting Trends (Or When Summer Ends)
Let’s head back to California for a second. Imagine it’s been a beautiful summer, but then one day, you notice it’s a little cooler. “No big deal,” you think. But then a few days later, it’s even cooler. And then it rains again. Suddenly, we’re barely cracking 70 degrees most days. What’s happening?
Fall’s creeping in, my friend. And temperature distribution is shifting. Soon, it’ll find a new center and new range that’s offset to the left.
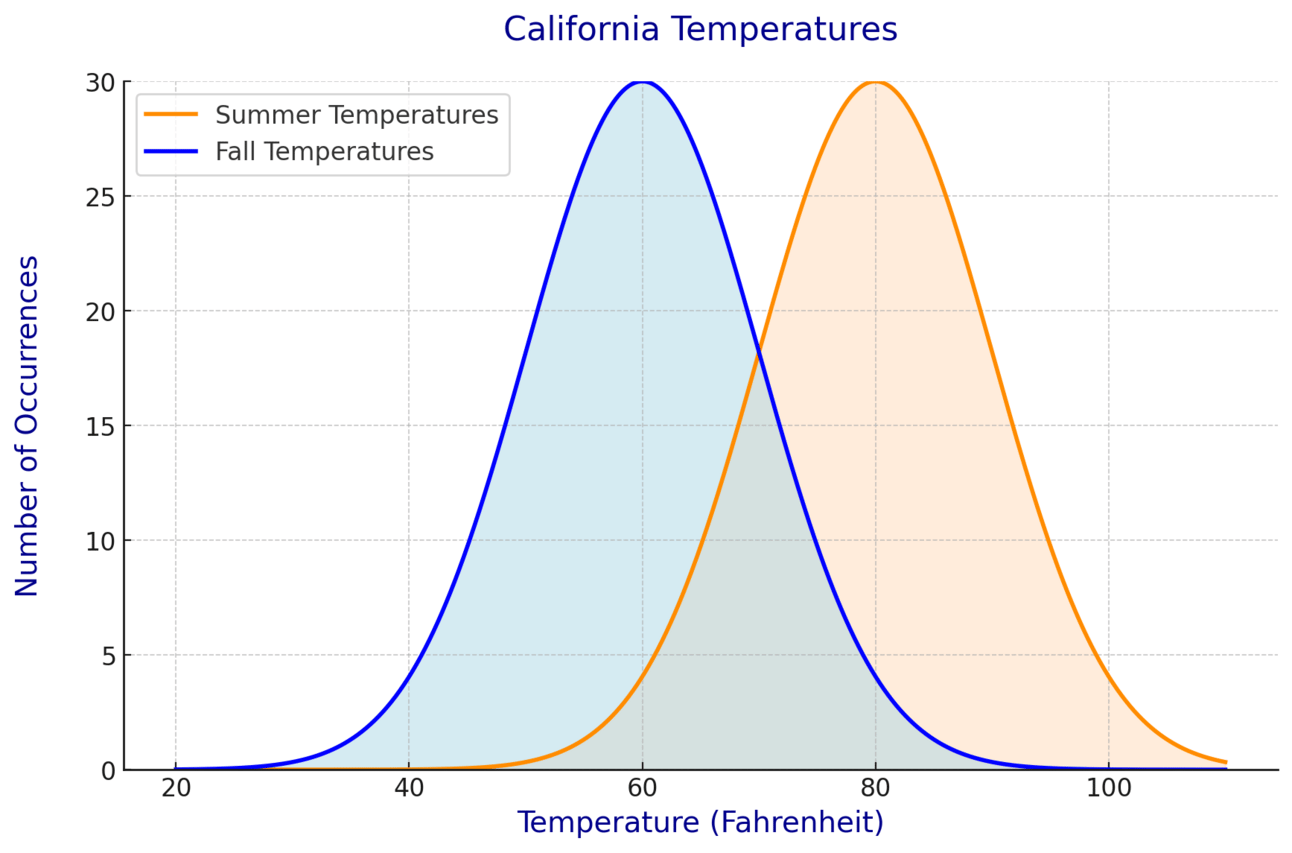
Temperature Distribution Shifts Seasonally
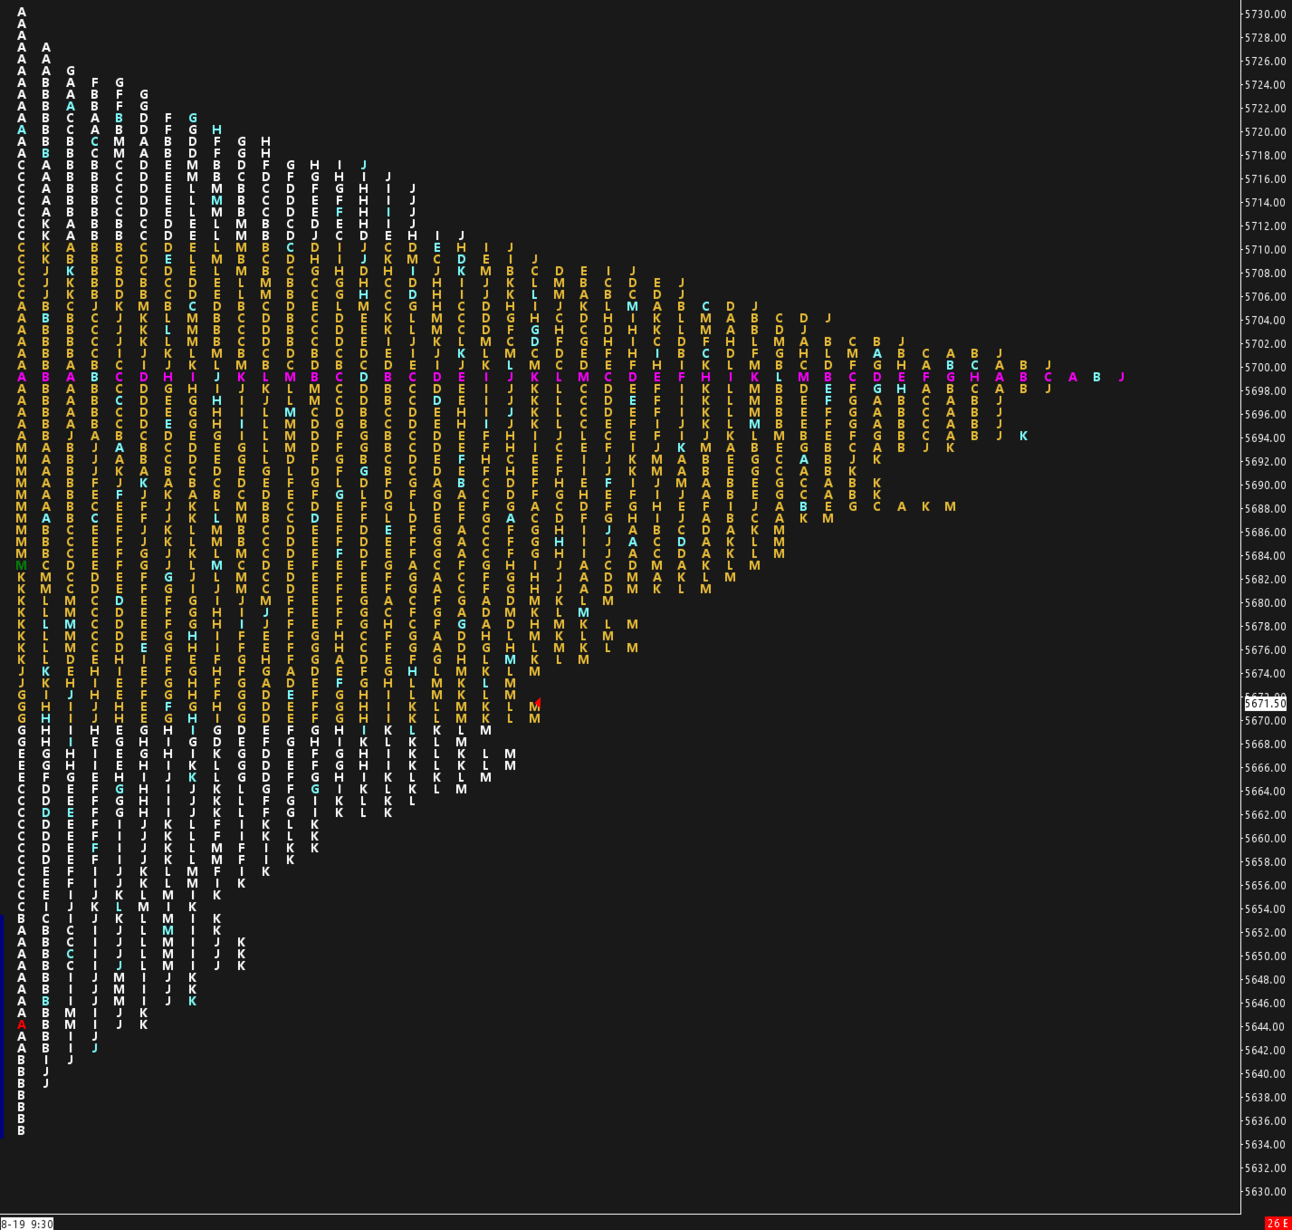
Just like the weather shifts with the seasons, the market’s distribution can shift too. Maybe it’s earnings, maybe it’s a macro event, or maybe some big player just decides to move the market. Here’s what that looks like on the market profile:
ES Market Profile: Migrating to a New Distribution
You can see the two long term distributions, along with a few days we had in between as we migrated. We call these trend days. The market doesn’t revert back to the middle—it migrates to a new range. And treating a trend day like a balance day? Yeah, that’s how you ruin your day, and your account.
Funny enough, a little while back, I asked our TWT members to give me examples of the days they found hardest to trade. After analyzing several, I noticed a pattern. Almost every single one of them involved a shift from a balancing market to a trending one, or vice versa. Adapting is hard, especially if the market has lulled you into expecting a pattern.
How to Spot the Shift: The Million Dollar Question
So, how do you know when the market’s about to trend? If I could answer that perfectly every time, I’d be sitting on my own island right now. The truth is, no one knows exactly when the market’s going to break out. Anyone who claims otherwise is lying.
But I’ve got a few tricks up my sleeve. I won’t spill all the beans here, but let’s just say you can feel when the market’s got a little extra "oomph" as it approaches the edge of a distribution. If you watch closely enough, you’ll know the difference between the market just poking around and the real deal.
Trends Vs. Balance
A trend is the market’s price discovery process of migrating to a new distribution. Being able to adapt between trending and balancing markets is a crucial skill to grow as a trader.
Ready to Go Deeper?
Still with me? Great. Tenet #3 might sound simple, but it’s got layers. If you want to dive deeper into how I use it, here’s what we’re doing in TWT:
An entire lesson dedicated to the 3 Tenets of Order Flow, including a deep dive into #3.
All my tricks to catch trend days in great detail.
A full breakdown on how to combine profiles, and how to interpret them.
Plus, I’m live every morning, walking you through exactly how I apply these concepts in real-time trades.
You’ll also get access to:
Daily Plans: Get an idea of the expected distribution for the day.
Orderflow Bot: Helps you gauge whether the market’s got that “oomph.”
Vol Bot: Our TradingView algo that uses options flow to predict reversals.
Set’s Journal: Deep dive into each of Adam Set’s trades.
TWT Community: A dedicated group of traders to keep you sane on the journey.
If you want to get the full scoop, read all about it here.
Oh, and remember that promise I made? A limited time discount equal to the Fed’s recent rate cut? Well, 50 bps means we’re giving you 50% off your first month, quarter, or year.
Use the discount code “CUTS” (no quotes) for 50% off your first subscription period. Not convinced? There’s a 7-day money back guarantee, so give it a shot, no risk!
Still On The Fence?
If you’re really worried about being burned by yet another subscription, don’t fret any longer. Just hop into our Discord. It’s completely free, and you’ll instantly get:
Live Morning Sessions: 2-3 times a week, enjoy the first 10 minutes of our morning live free, where we share market insights, key levels, and our daily trade plan.
Bot Alerts in Action: See how our AI-powered Orderflow Bot spots market opportunities before they unfold (free tier alerts delayed by 15 mins).
Community Brilliance: Engage with a tribe of serious traders. Learn new strategies, share insights, and feel the support of a community that's got your back. I’m always around to answer any questions you have.
Anything else on your mind? Requests, complaints, funny memes? Doesn’t matter. Just reply to this email. Yes, I read every response, and I love chatting about markets or anything else with you all.
Catch you next time,
Jay